I wanted one GPU to keep up with my coding workflow: me, Claude Code, and roughly three agents working through a repository.
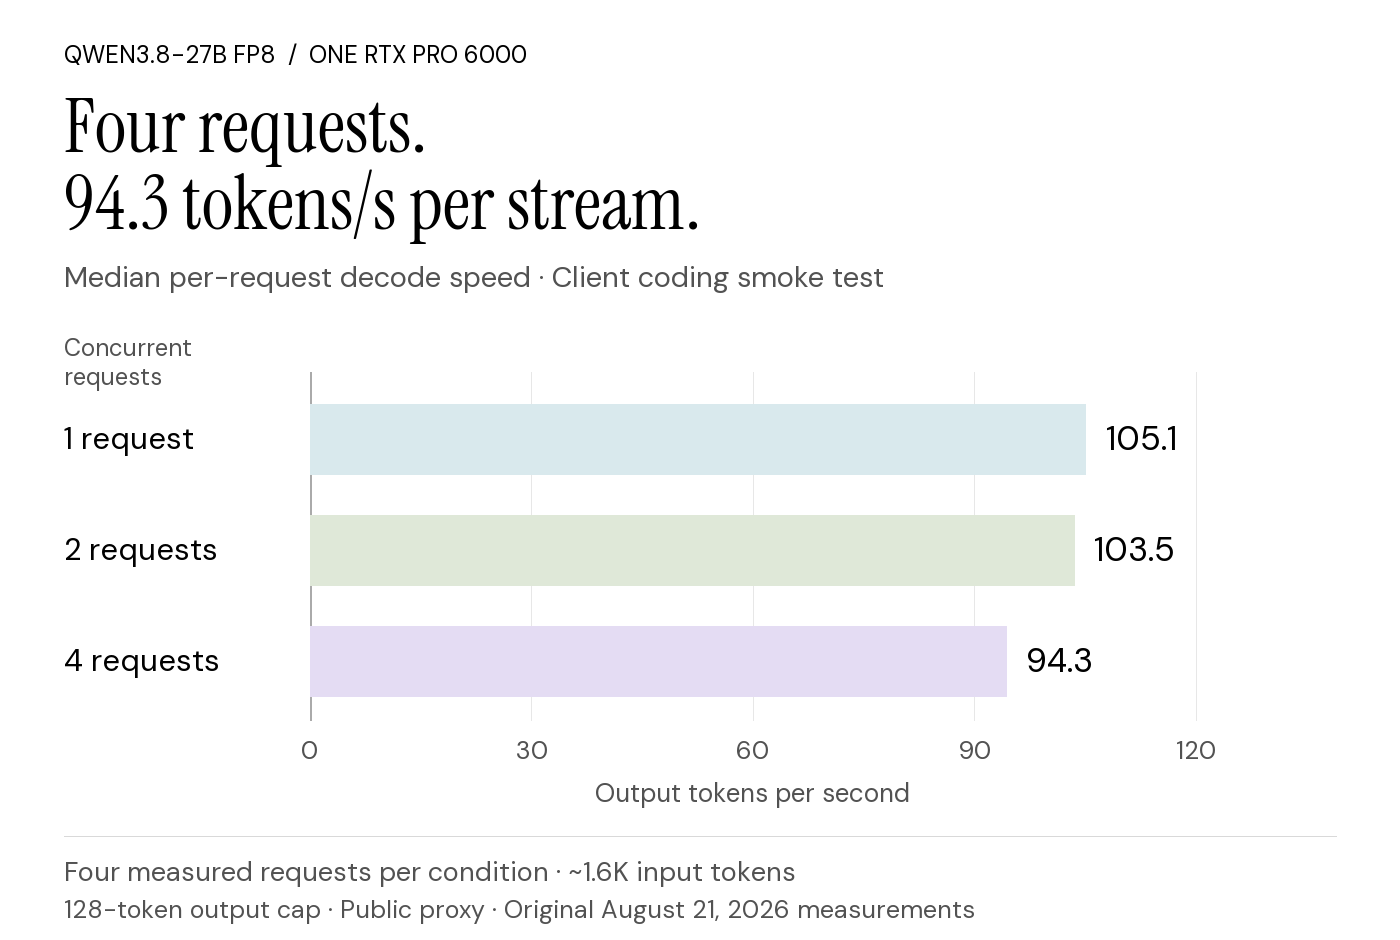
With Qwen3.8-27B FP8 on one RTX PRO 6000, four concurrent coding requests reached a median 94.3 output tokens per second per request. That was the result I cared about. Adding concurrent work did not make each stream slow to a crawl.
It was a small smoke test—four measured requests per condition, with short outputs—not a sustained-load benchmark. Here is exactly what ran, what the numbers mean, and where I still need better evidence.
The setup · Coding results · Twenty requests · Limits · Sources
Four requests, one GPU
- One coding request: 105.1 tok/s median decode speed.
- Four coding requests: 94.3 tok/s median per request; 196.0 tok/s across the whole client test.
- Two real agent requests: roughly 140–175 tok/s aggregate in engine logs.
- Four predictable synthetic requests: roughly 510–515 tok/s aggregate in engine logs.
The last number is a different kind of result. Predictable output was much easier for speculative decoding than coding traffic. And an engine’s active-generation throughput is not the same as a remote client’s throughput over an entire request.
The sample is too small for strong statistical conclusions. In particular, the p95 figures below should not be treated as reliable estimates of tail latency.
The setup
I used an NVIDIA RTX PRO 6000 Blackwell Server Edition with 96 GB of memory—97,887 MiB as reported by the environment. The instance cost approximately $2.12 per hour at the time of the experiment.
I chose Qwen/Qwen3.8-27B-FP8, a dense 27B model with a hybrid GDN architecture. Its advertised 262,144-token context appealed to me: a 64K limit was not especially attractive for long repository conversations.
SGLang served the model from the lmsysorg/sglang:qwen38-27b container, with an FP8 E4M3 KV cache. I enabled the model’s in-checkpoint MTP through SGLang’s EAGLE path; there was no separate draft model.
SGLang: 0.0.0.dev0+qwen38.27b.g561c8f3
PyTorch: 2.13.0+cu130
CUDA userspace: 13.0
NVIDIA driver: 595.91.07
Driver CUDA compatibility: 13.2
GPU capability: SM 12.0
Those CUDA values describe different things: the driver reported compatibility with CUDA 13.2, while the container used CUDA 13.0 userspace.
This was my August 21 launch command. The container tag and current cookbook can change; the version strings above identify the environment I measured.
sglang serve \
  --trust-remote-code \
  --model-path Qwen/Qwen3.8-27B-FP8 \
  --served-model-name qwen3.8-27b-fp8 \
  --context-length 262144 \
  --kv-cache-dtype fp8_e4m3 \
  --mem-fraction-static 0.85 \
  --attention-backend flashinfer \
  --chunked-prefill-size 2048 \
  --max-running-requests 4 \
  --max-mamba-cache-size 20 \
  --mamba-radix-cache-strategy extra_buffer \
  --mamba-ssm-dtype float32 \
  --speculative-algorithm EAGLE \
  --speculative-num-steps 3 \
  --speculative-eagle-topk 1 \
  --speculative-num-draft-tokens 4 \
  --enable-linear-replayssm-spec \
  --reasoning-parser qwen3 \
  --tool-call-parser qwen3_coder \
  --host 0.0.0.0 \
  --port 30000 \
  --api-key "$SGLANG_API_KEY"
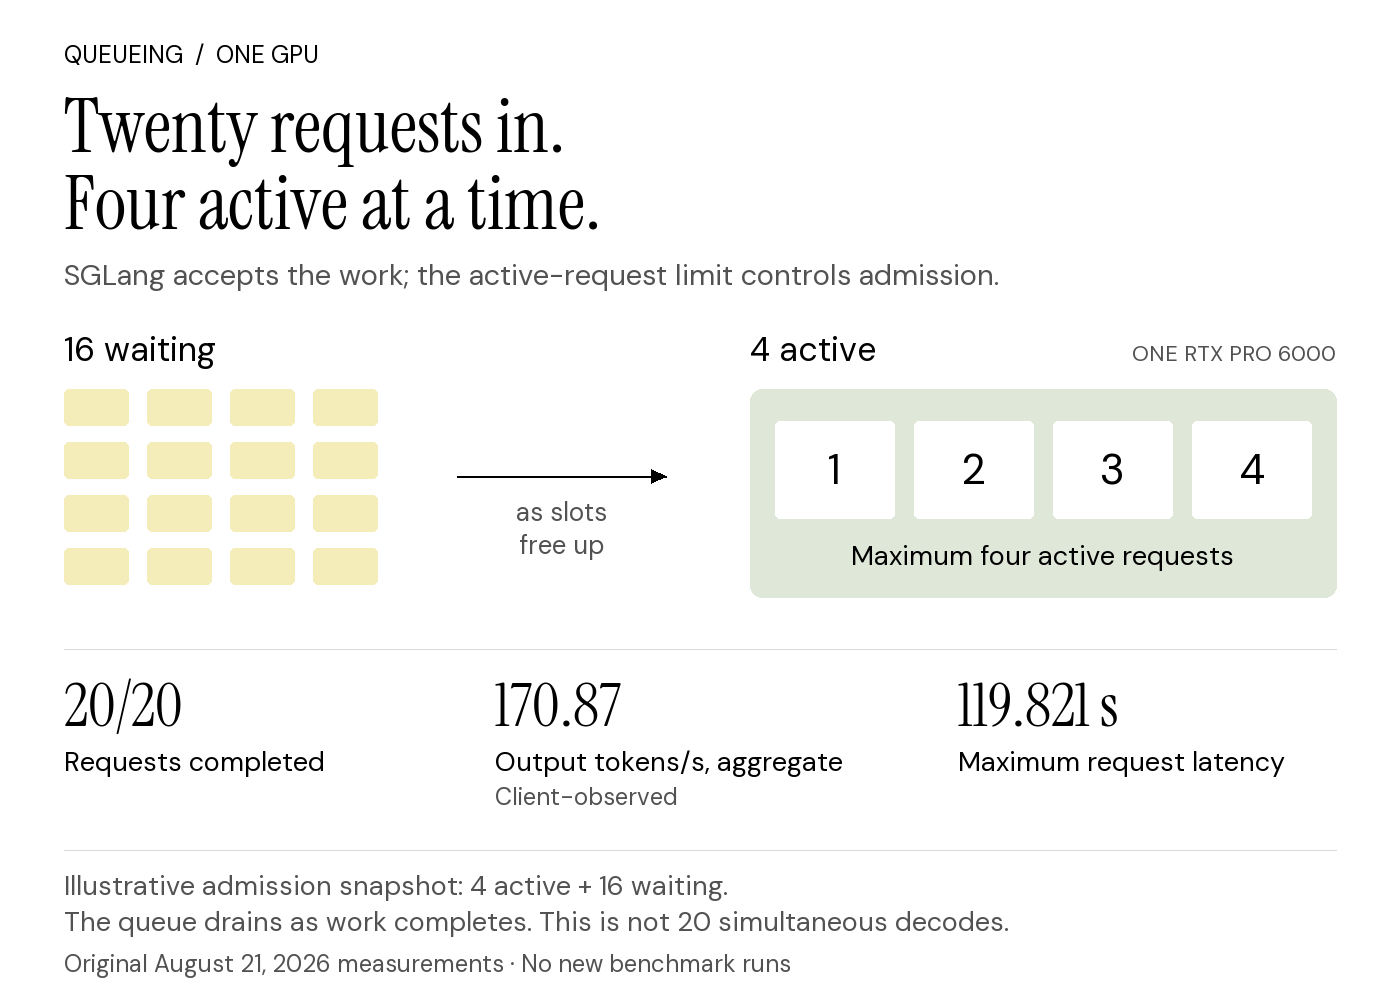
I capped active requests at four. With extra_buffer in this configuration, five Mamba state slots are needed per active request, so 4 × 5 = 20 cache slots. Additional HTTP requests could queue; they would not all generate simultaneously.
The SGLang Qwen3.8-27B cookbook discusses how large prefill chunks can stall decode on the hybrid GDN path. I used a 2,048-token chunk to favor smoother interactive behavior. Peak throughput was useful only if the agents still felt responsive.
Connecting Claude Code
I pointed Claude Code at SGLang’s Anthropic-compatible endpoint and mapped its model selections to the same served model:
export ANTHROPIC_BASE_URL="https://YOUR-ENDPOINT"
export ANTHROPIC_AUTH_TOKEN="YOUR_KEY"
export ANTHROPIC_MODEL="qwen3.8-27b-fp8"
export ANTHROPIC_DEFAULT_OPUS_MODEL="qwen3.8-27b-fp8"
export ANTHROPIC_DEFAULT_SONNET_MODEL="qwen3.8-27b-fp8"
export ANTHROPIC_DEFAULT_HAIKU_MODEL="qwen3.8-27b-fp8"
export CLAUDE_CODE_SUBAGENT_MODEL="qwen3.8-27b-fp8"
export CLAUDE_CODE_EFFORT_LEVEL="medium"
export API_TIMEOUT_MS=1800000
Tool use worked during real repository work: inspecting code, running Git commands, and querying open pull requests.
Reasoning effort needed an adjustment. The endpoint accepted low, medium, and xhigh, but selecting xhigh in the client UI sent max. The server returned:
Unexpected reasoning effort max. Supported types are xhigh (default), medium, and low.Setting CLAUDE_CODE_EFFORT_LEVEL="medium" fixed that mismatch.
This compatibility layer translates Anthropic messages into SGLang’s internal/OpenAI request path. Anthropic does not support routing Claude Code to non-Claude models. Working tool use in this experiment does not mean every client option maps cleanly.
The coding test
My Python client streamed requests to /v1/messages from my Mac, through the public RunPod proxy.
- Prompt: unique-prefix coding, approximately 1,600 actual input tokens per request.
- Generation: medium reasoning effort, with a 128-token output cap.
- Run: one warmup and four measured requests per condition, at concurrency 1, 2, and 4.
Output speed
| Metric | 1 active | 2 active | 4 active |
|---|---|---|---|
| Successful requests | 4/4 | 4/4 | 4/4 |
| Median decode (tok/s per request) | 105.1 | 103.5 | 94.3 |
| Aggregate output (tok/s) | 51.4 | 107.8 | 196.0 |
| Aggregate input (tok/s) | 643 | 1,348 | 2,450 |
| Aggregate input + output (tok/s) | 695 | 1,456 | 2,646 |
Latency
| Metric | 1 active | 2 active | 4 active |
|---|---|---|---|
| First token, p50 (ms) | 1,230 | 957 | 1,075 |
| First token, p95 (ms) | 1,500 | 1,398 | 1,320 |
| End-to-end, p50 (ms) | 2,520 | 2,285 | 2,505 |
| End-to-end, p95 (ms) | 2,677 | 2,588 | 2,602 |
| Time per output token, p50 (ms) | 9.53 | 9.66 | 10.61 |
Going from one request to four changed median decode speed from 105.1 to 94.3 tok/s. Across the full four-request test, aggregate output throughput was 196.0 tok/s.
These measurements use different time windows. Per-request decode speed describes generation; whole-test throughput also includes the time spent reaching that generation.
Reading these metrics
Time to first token—TTFT—includes the internet path, public proxy, queueing, scheduling, prefill, and first decode step. The input throughput in the table is also client-observed, not raw GPU prefill speed.
To separate the public network path from serving performance, I need the same test against localhost on the pod, with engine logs alongside it. The remote measurement still matters: it is what the client experiences.
The 128-token output cap was too short for some reasoning requests to reach an answer. TTFT here means the first thinking or text delta, not necessarily the first visible answer. First-visible-text latency was not reliably reportable.
That limits what these runs say about sustained generation. The next round needs 512–1,024 output tokens.
What I recorded
The client recorded request throughput and actual API token counts; aggregate input and output throughput; response-header latency, TTFT, first visible text, and end-to-end latency; time per output token and per-request decode speed; streaming chunk intervals; failures; and achieved concurrency.
It did not save API keys, prompts, or generated content.
Where 500+ tok/s came from
Without EAGLE, I observed 44.7 output tok/s on one active sequence of roughly 33K tokens. With EAGLE, ordinary single-stream work was generally around 70–100 tok/s.
These are log observations, not a controlled, identical-workload comparison with the short client test. Two examples show how speculative acceptance changed alongside throughput:
accept len: 2.55  accept rate: 0.52  gen throughput: 76.28 tok/s
accept len: 3.23  accept rate: 0.74  gen throughput: 96.53 tok/s
Two real agent requests produced around 140–175 tok/s aggregate in engine logs. One sample showed two running requests, acceptance length 3.12, acceptance rate 0.71, and 175.47 tok/s.
The predictable synthetic workload was easier. With four active requests, acceptance length reached about 3.99–4.00 and acceptance rate reached 1.00. Throughput was roughly 510–515 tok/s; one sample recorded 514.97 tok/s.
Normal coding acceptance was more often around 0.4–0.7, with roughly 70–100 tok/s per stream. Several realistic coding requests were broadly in the 150–200 tok/s aggregate range in my observations.
If I publish only the highest number, I leave out the reason it was high. A useful comparison needs the workload, concurrency, acceptance rate and length, and both client and engine throughput.
Twenty requests, four active slots
I also sent 20 simultaneous HTTP requests. All completed, but the server still allowed only four active requests:
| Metric | Result |
|---|---|
| Successful requests | 20/20 |
| Total output tokens | 20,480 |
| Wall-clock duration | 119.858 seconds |
| Client aggregate output throughput | 170.87 tok/s |
| Average request latency | 38.877 seconds |
| Minimum request latency | 10.323 seconds |
| Maximum request latency | 119.821 seconds |
--max-running-requests 4. Other requests waited in the queue.Engine logs reached roughly 440–515 tok/s during this predictable workload. Over the full run, the client averaged 170.87 tok/s. One request took almost two minutes.
Twenty accepted requests did not mean 20 simultaneous decodes. Most had to wait. That waiting time is part of what a user experiences, even when active generation looks fast.
What I have not proved
Full-context performance
I configured 262,144 tokens, matching the model’s advertised context. Claude Code conversations with tens of thousands of tokens worked. The controlled client test used only about 1.6K input tokens per request.
I have not published a controlled full-262K prefill benchmark or a concurrent long-context benchmark. The configured limit does not establish how memory, latency, and concurrency behave near that limit.
A continuously active team
The results look promising for one developer running roughly three agents. A 20–30-person team might fit a bursty workload, with only a few requests generating at once. These runs do not prove that 20–30 developers can generate continuously at the reported speeds.
To investigate 20 active requests, the corresponding limits would be:
--max-running-requests 20
--max-mamba-cache-size 100
Under the same cache assumptions, that follows 20 × 5 = 100 Mamba state slots. I have not tested this configuration. I would need to measure memory use, maximum stable context, queueing, TTFT, and how much each user slows down.
What I will test next
Median coding TTFT around one second is encouraging for this public endpoint. To understand whether it holds up, my next benchmark matrix would use:
- Concurrency: 1, 2, 4, 8, 16, and 20; at least five requests per concurrency slot.
- Workloads: unique-prefix coding, shared-prefix coding, and predictable counting, reported separately.
- Lengths: 8K and 32K inputs, a substantially longer-context condition, and 512–1,024 output tokens.
- Paths: both the public proxy and pod-local localhost.
- Metrics: client and engine throughput, MTP acceptance, prefill, TTFT, time per output token, end-to-end latency, queue depth, and maximum active requests.
- Repetition: three runs per condition, keeping every result.
SGLang’s serving benchmark guide is a reference for that work. This is a plan, not another set of results.
For now, single coding streams were broadly around 70–105 tok/s across my observations. The number I would build on is the four-way coding result: approximately 94 tok/s per request, with all four generating.
That is close to the workflow I wanted. For one developer running three agents, it felt fast. Next I want to find where it stops feeling fast—and measure those runs too.
Sources and experiment record
The performance numbers, price, configuration, and tool-use observations are from my experiment, first published on August 21, 2026. The references below document the model and serving behavior; they do not independently verify my measurements.
- Qwen’s official model card — architecture, native context length, MTP, and supported reasoning levels.
- SGLang’s Qwen3.8-27B cookbook — hybrid-state caching, prefill, speculative decoding, and API compatibility. The current recipe may differ from my recorded build.
- SGLang’s serving benchmark guide — benchmark metrics and test design. My measurements used my own Python client.
- Claude Code’s gateway documentation — supported routing and the limitations of non-Claude models.
- My original LinkedIn experiment report — August 21, 2026.
Sources checked September 9, 2026. This edition adds clearer tables and graphics of the original measurements, with no new benchmark runs. The original article was polished by GPT‑5.6‑Sol through Codex; this edition was also edited in Codex. The deployment, experiments, logs, and measurements are my own.